Pi Coin (PI) is showing some life after a tough stretch. At the time of writing, the Pi Coin price sits near $0.36, up almost 3% in the past 24 hours and about 4% over the past week. The move might look encouraging for traders hoping the token has turned a corner.
But caution is warranted. A closer look at the charts suggests the price surge may not be what it seems. If current signals play out, this bounce could become a trapdoor to a new all-time low at $0.31.
Why the Bounce Looks Like a Trap
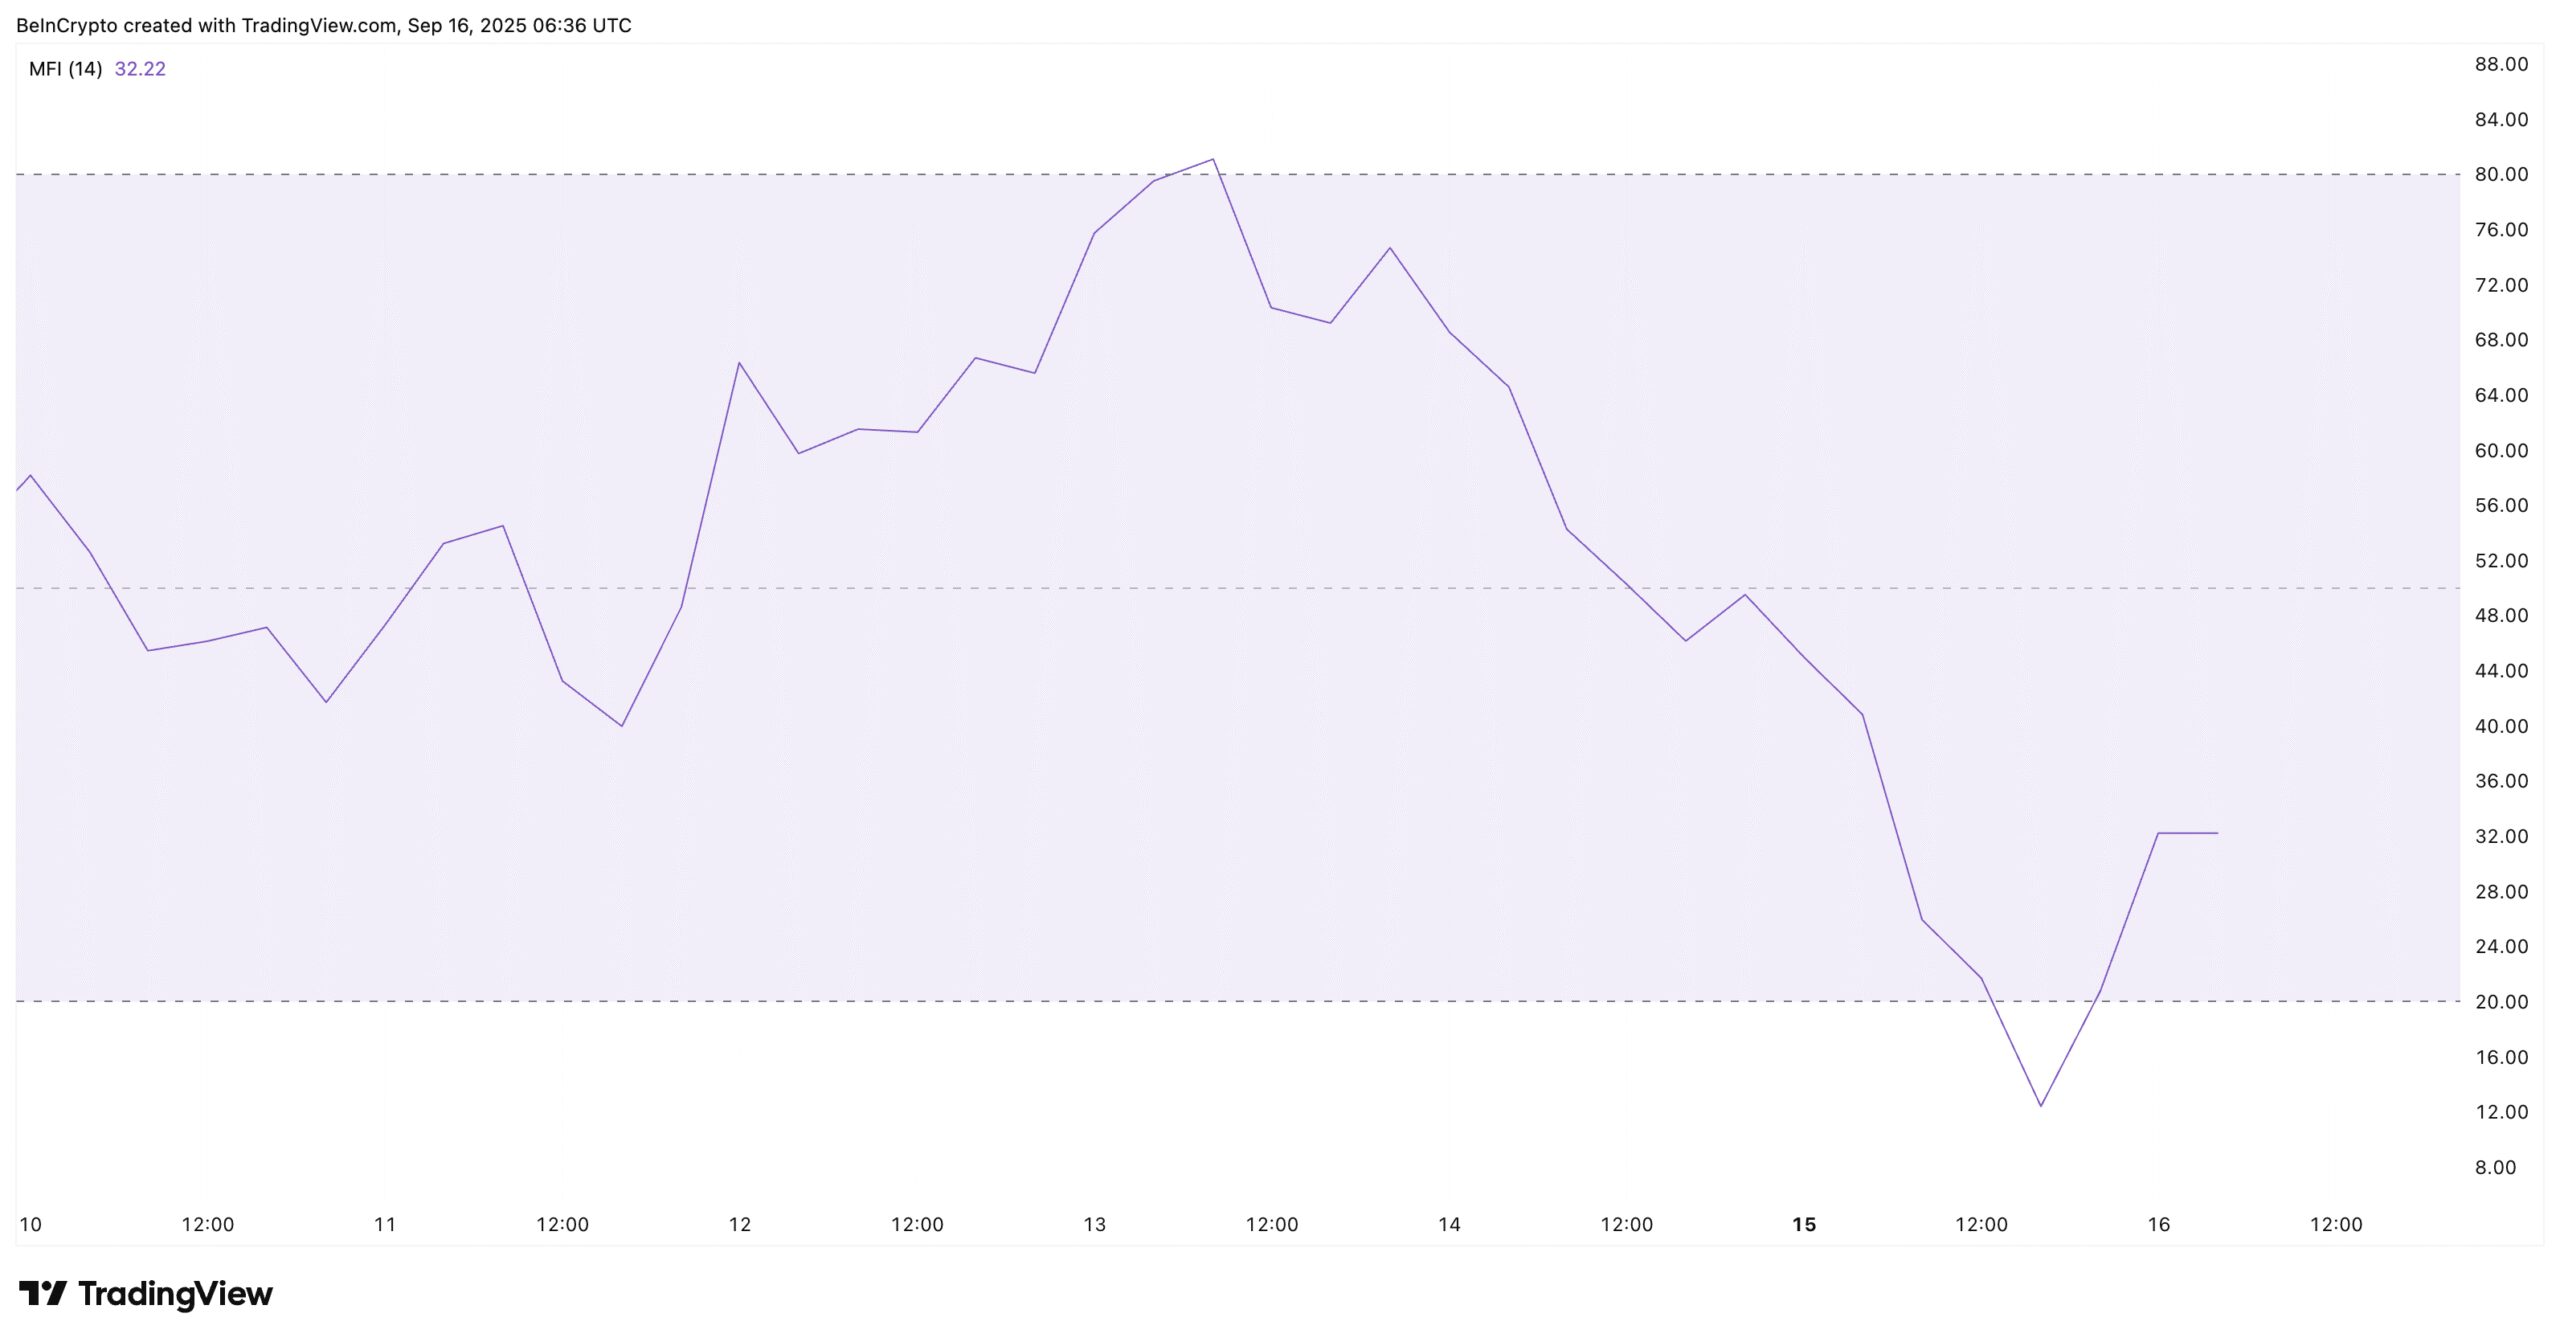
The first clue comes from the Money Flow Index (MFI), which tracks both price and trading volumes to show buying or selling pressure. MFI has risen sharply alongside this bounce, pointing to active dip-buying. On the surface, this looks healthy — it suggests traders are stepping in.
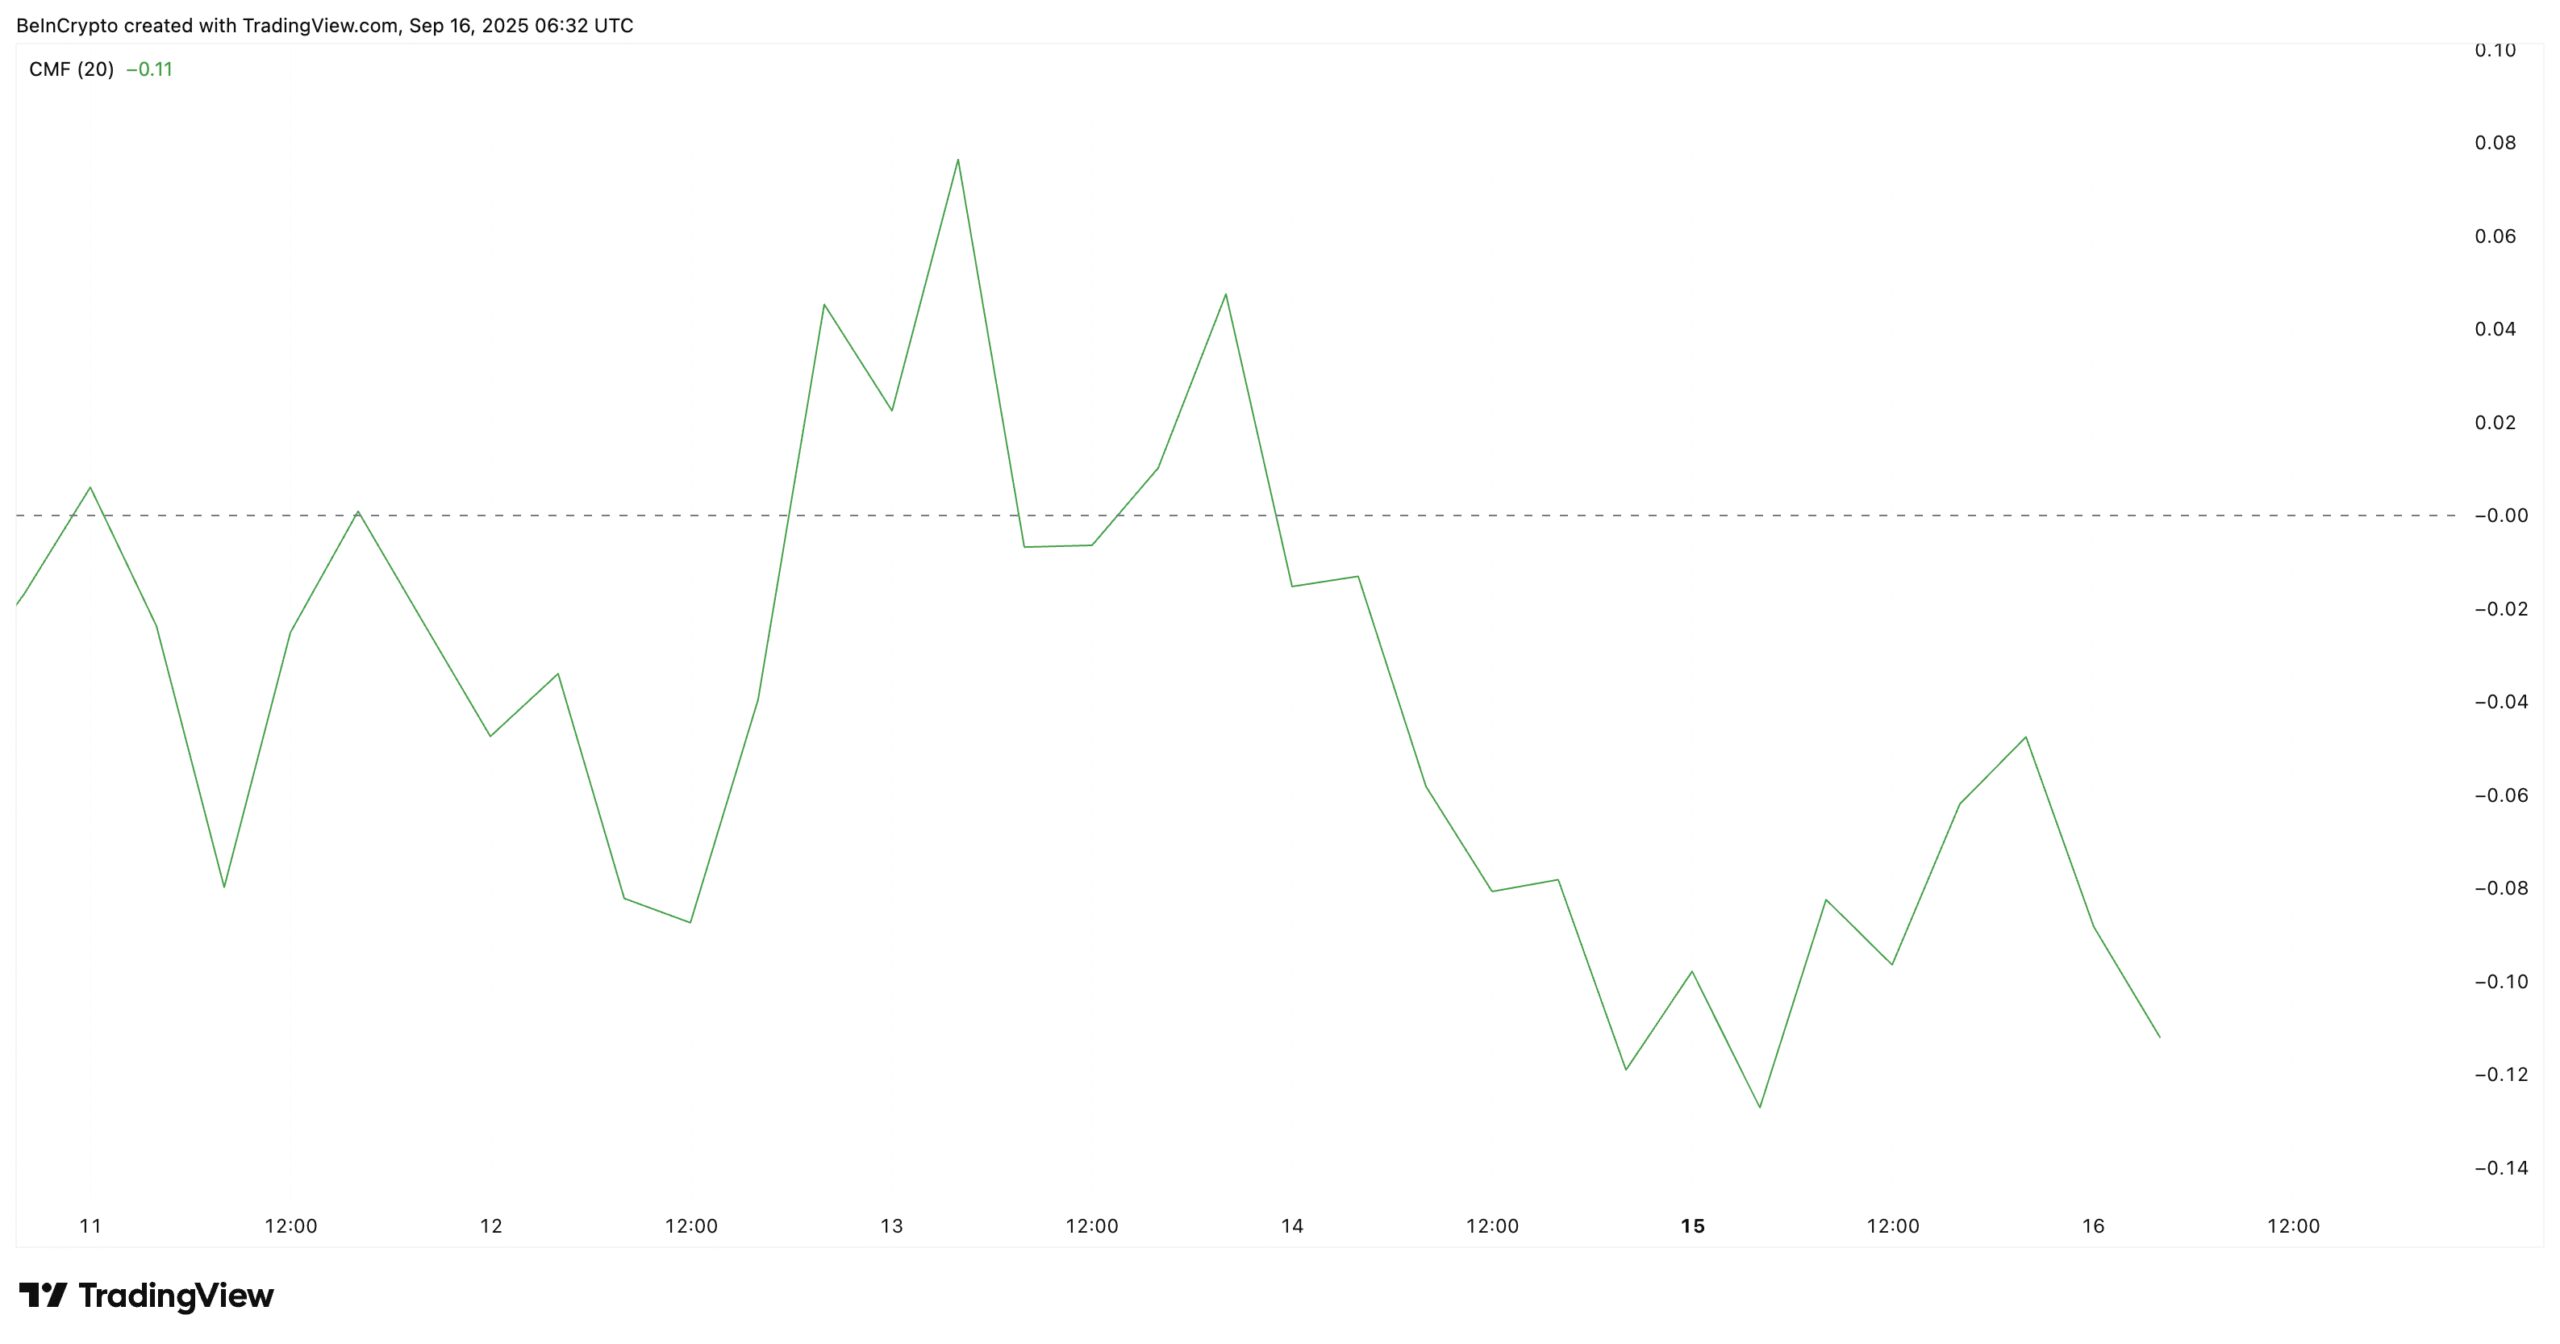
But the Chaikin Money Flow (CMF) tells another story by curling down and staying in the deep negative territory. CMF measures whether money is flowing into or out of the asset. Right now, CMF sits at -0.11, showing there are no meaningful inflows from bigger players but outflows.
Want more token insights like this? Sign up for Editor Harsh Notariya’s Daily Crypto Newsletter here.
That means the recent Pi Coin price uptick is retail-driven, without the backing of larger money. This mismatch between MFI and CMF often signals weakness.
Zooming out, the daily RSI (Relative Strength Index) makes things even clearer.
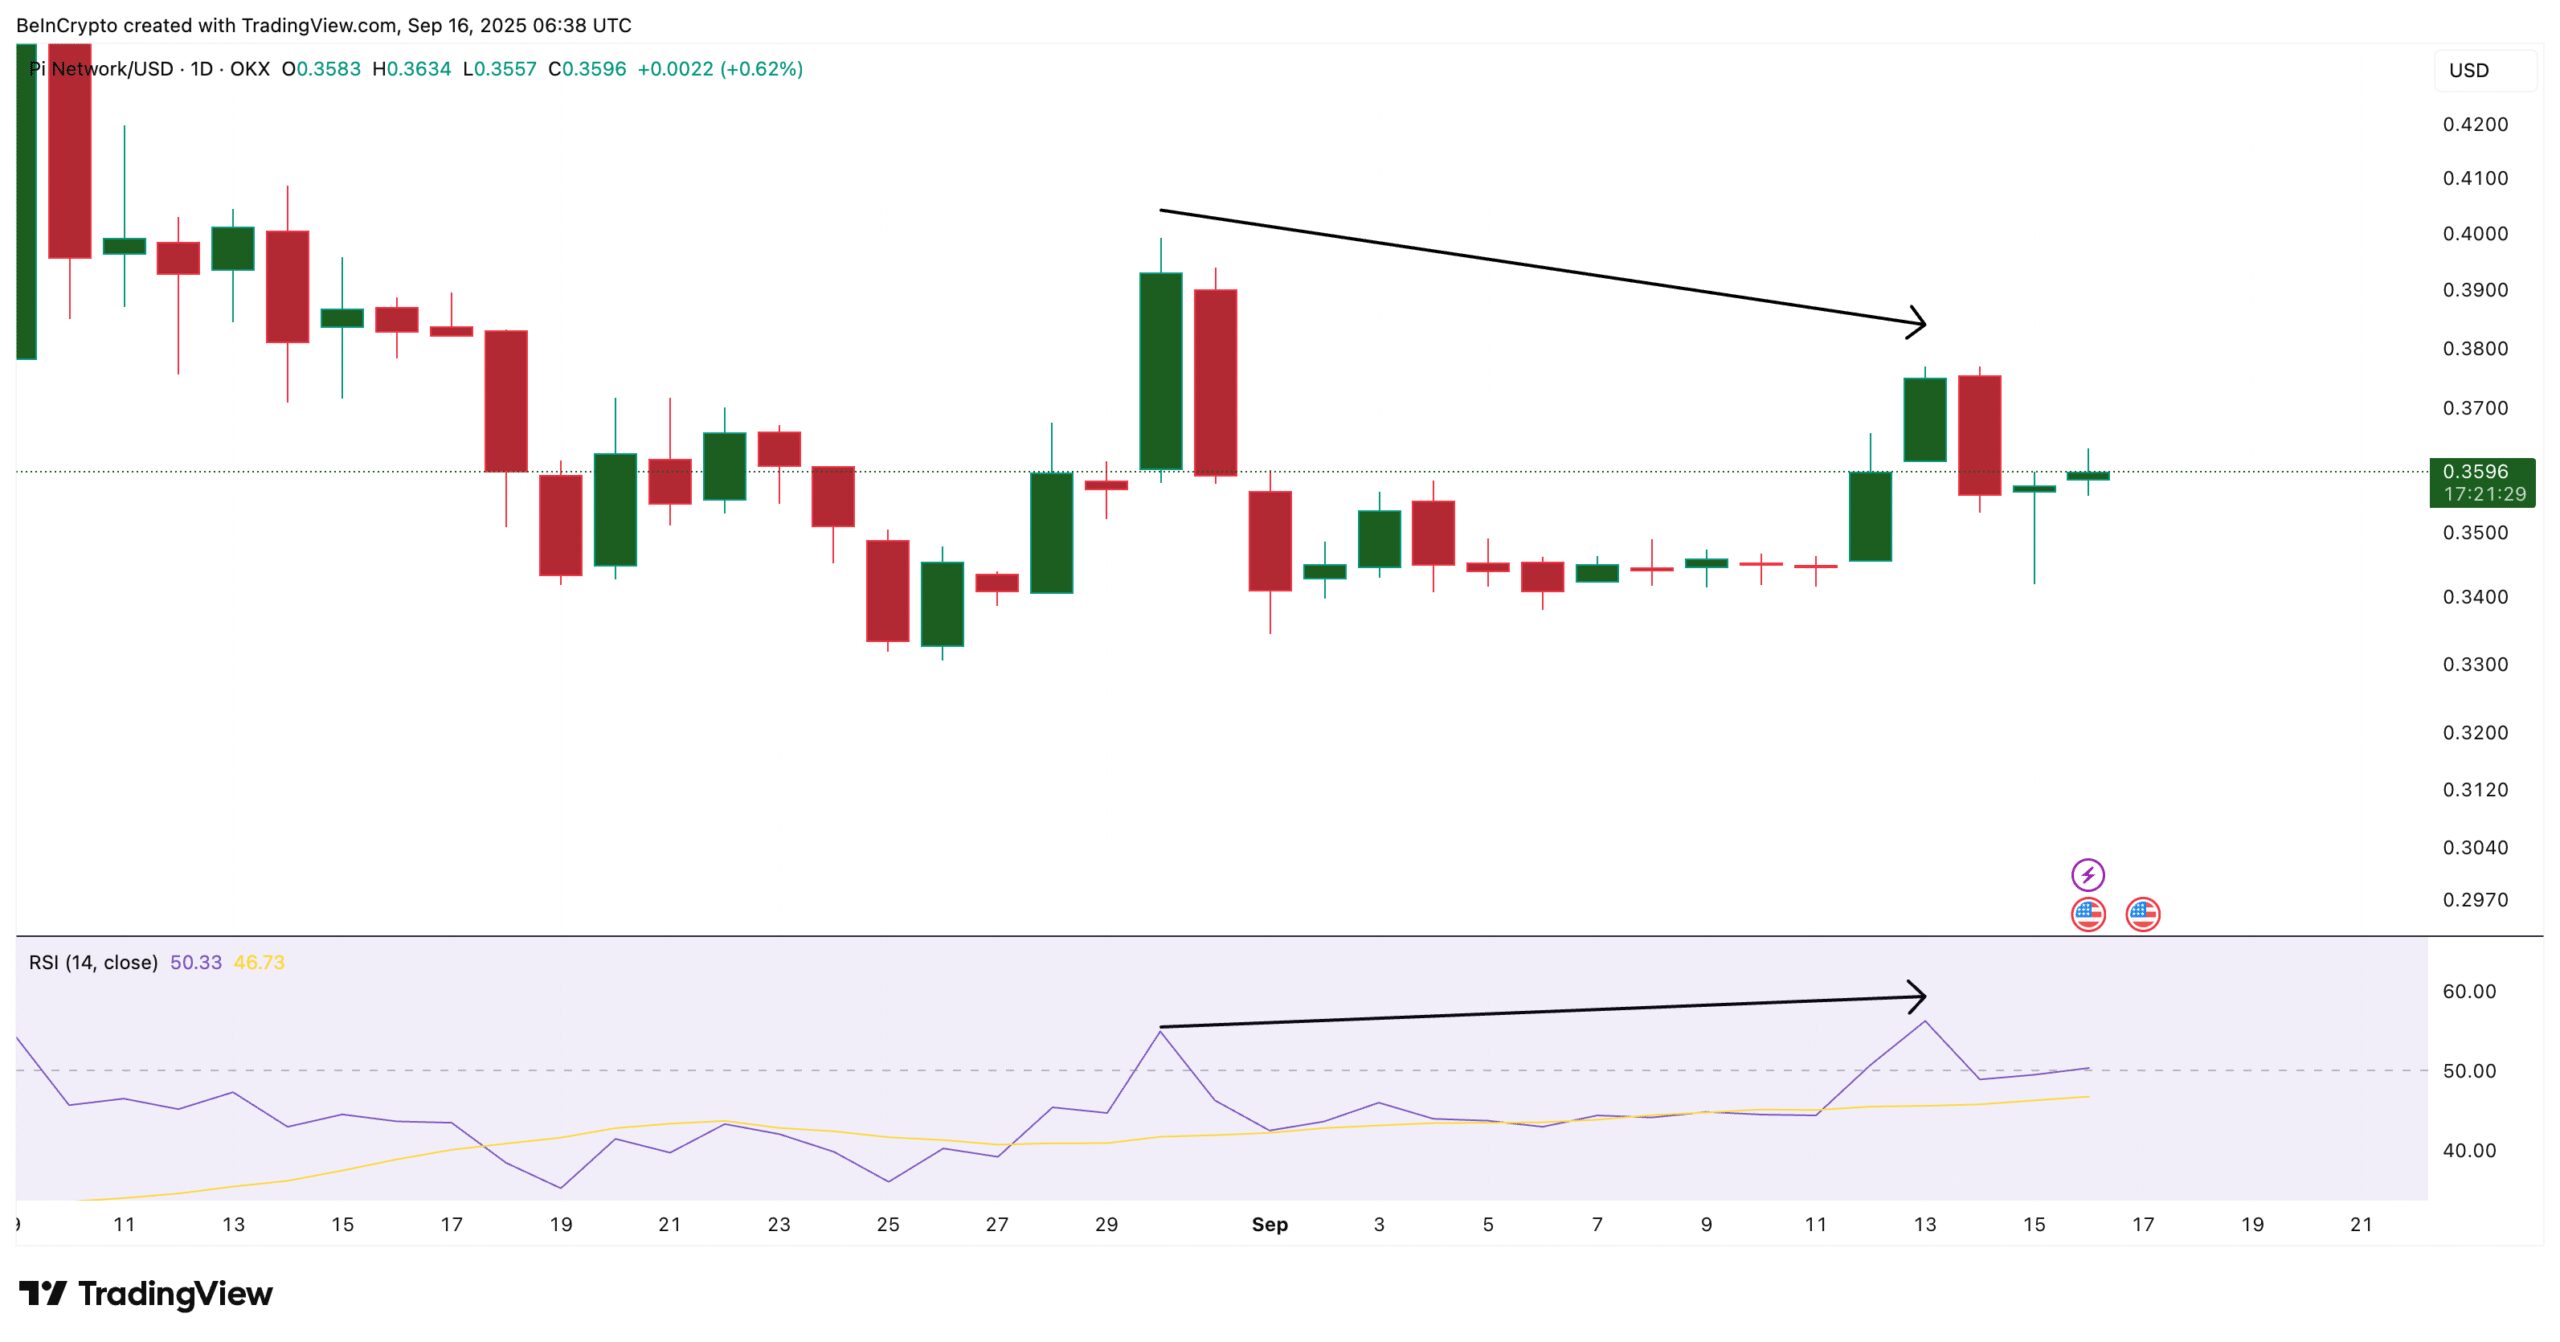
RSI compares the size of recent gains to recent losses. In this case, the Pi Coin price has made lower highs, but RSI has made higher highs. That’s a hidden bearish divergence, which typically points to continuing downtrends. Put together, the MFI-CMF split and RSI divergence confirm that the bounce may be nothing more than a trap.
Pi Coin Price Chart Presents the Trap With Key Levels
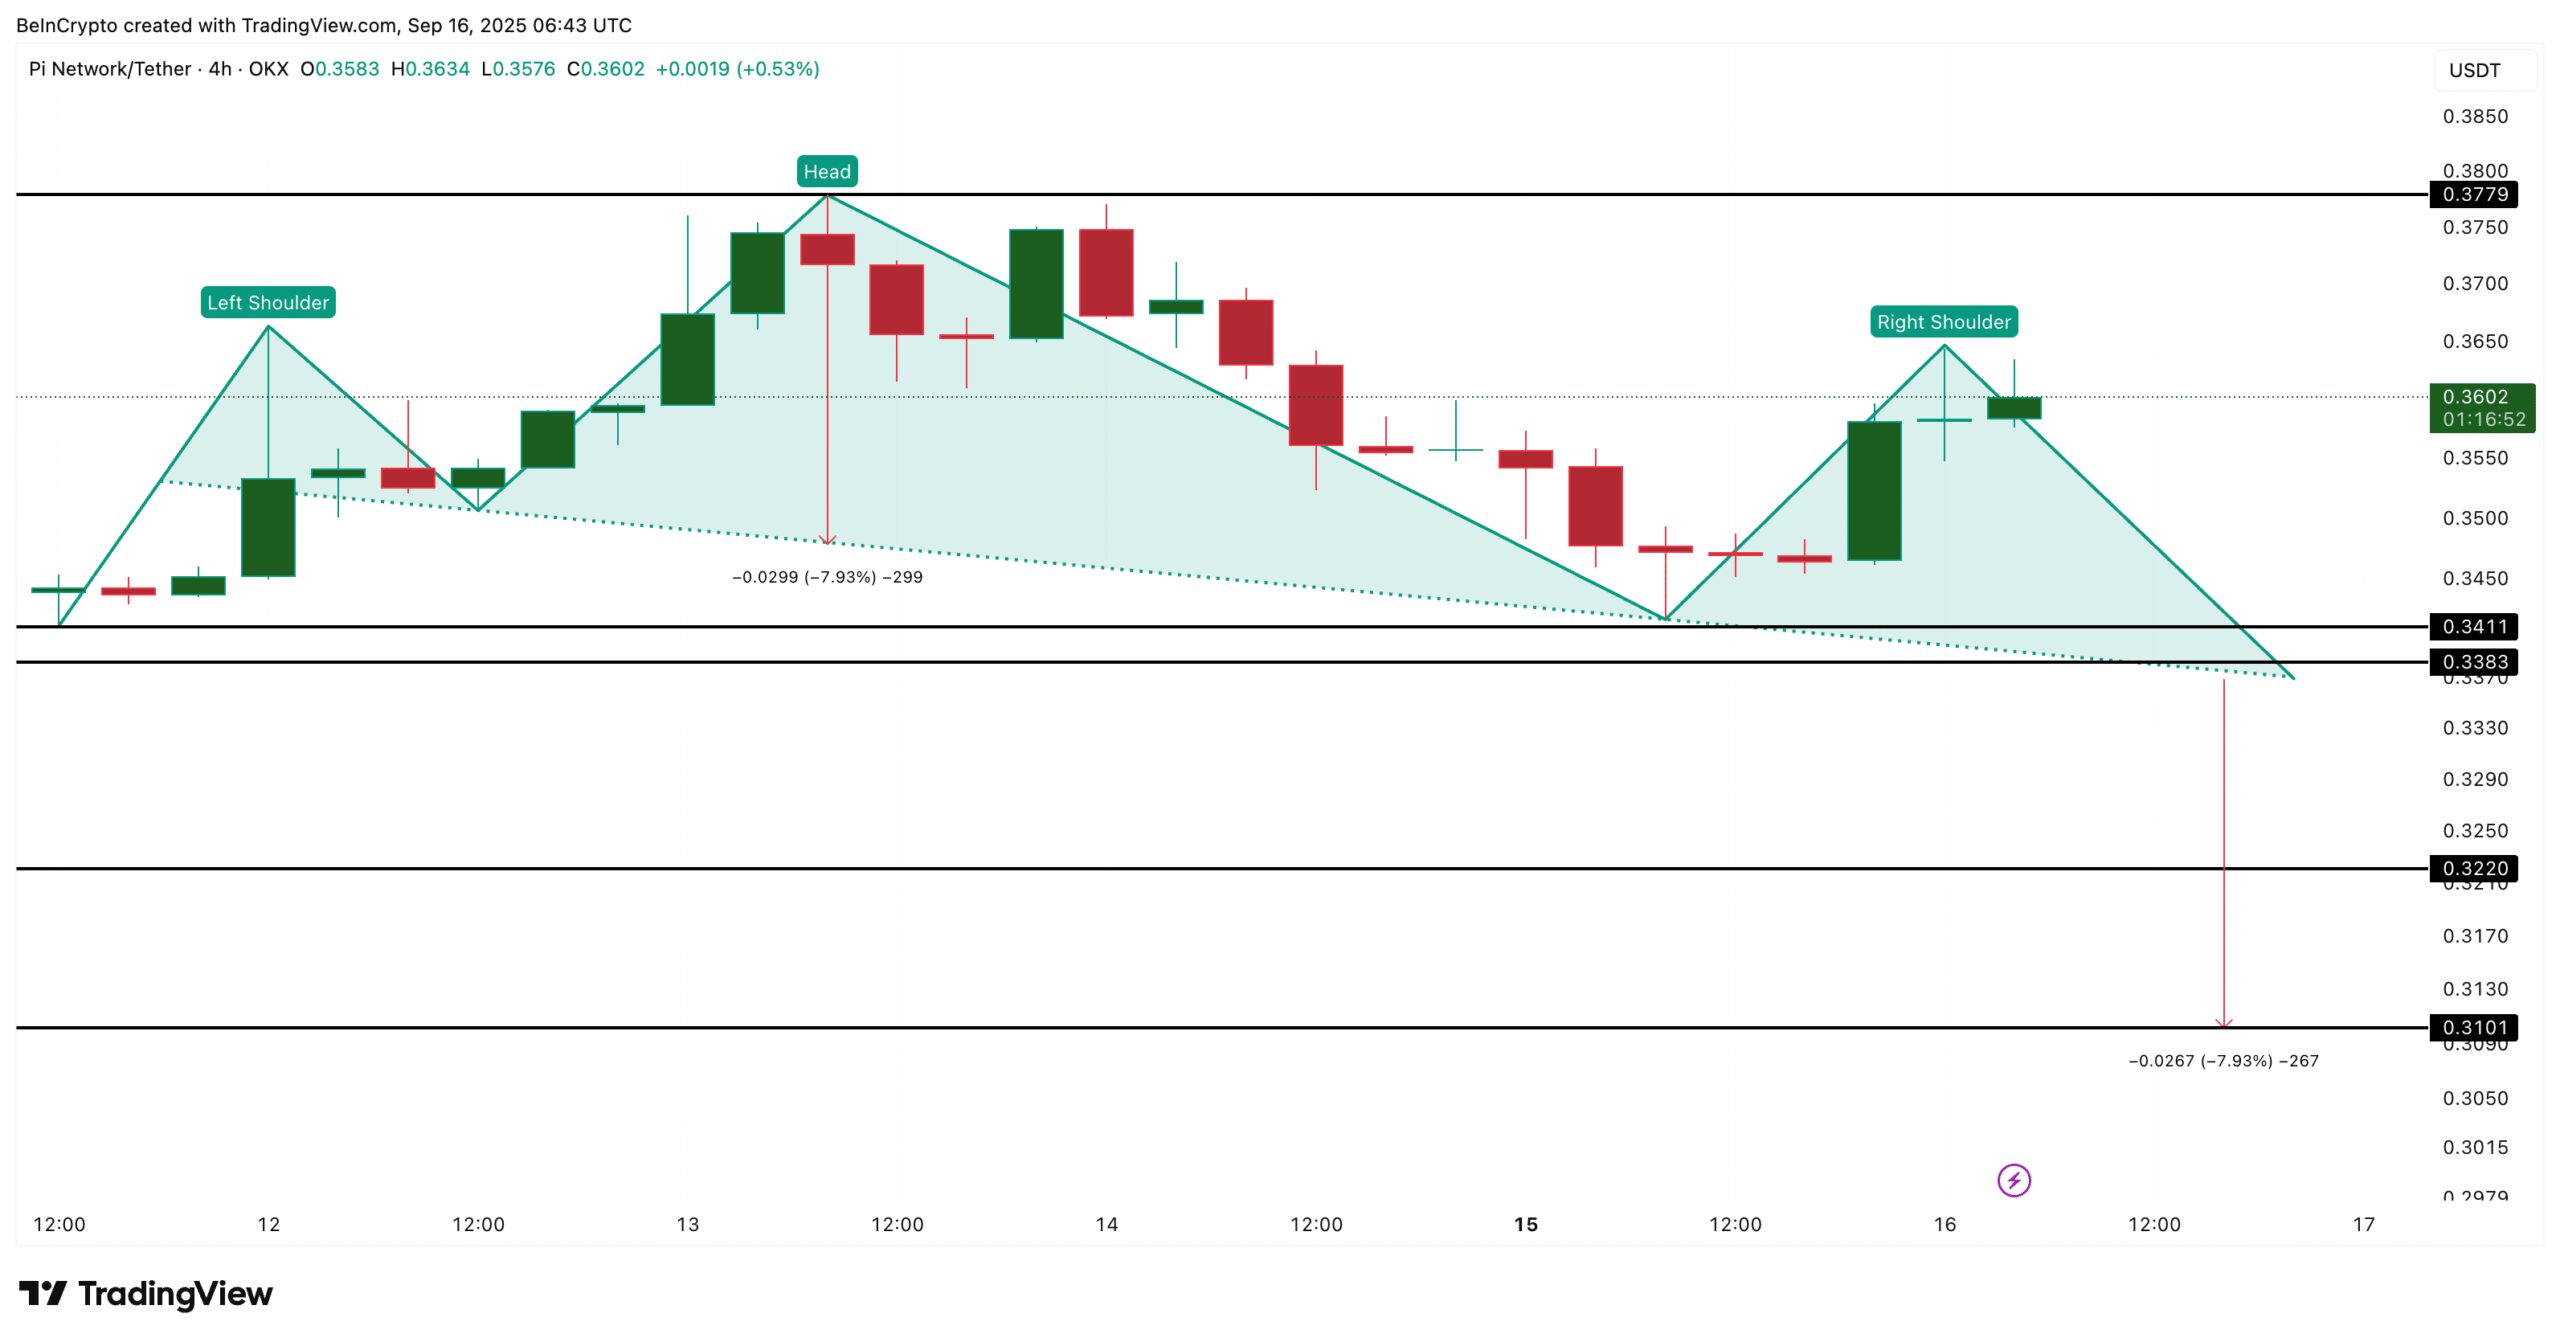
The 4-hour chart provides the final piece of the puzzle. The Pi Coin price appears to have formed a head-and-shoulders pattern, a classic bearish setup. The right shoulder peak seems complete now with the bounce, with the neckline sitting around $0.33. If price breaks below that neckline, the measured target points to a drop toward $0.31 — a new all-time low.
That’s why this bounce looks risky. While retail traders are fueling the short-term rise, broader indicators and chart structures are pointing down.
There is one way to invalidate this bearish setup: Pi Coin must reclaim $0.37 with a strong 4-hour close. That would break above the head area of the bearish pattern, restoring momentum for the bulls. Until that happens, the bounce is better seen as a trapdoor that could send the PI price lower.
The post Pi Coin Price Bounce Could Be a Trapdoor to a New All-Time Low — Here’s Why appeared first on BeInCrypto.