The Ethereum price has traded mostly sideways this week, rising just 1.3% over the past seven days to hover around $4,430. Even the month-on-month ETH price performance isn’t aggressive, with a minor 2.7% uptick.
Despite the muted performance, accumulation is quietly underway, suggesting that something bigger could be brewing beneath the surface.
Whales and Short-Term Holders Quietly Accumulate
The most notable shift comes from Ethereum whales. On-chain data shows that large holders have added nearly 870,000 ETH in the past 24 hours, increasing their combined stash from 99.34 million to 100.21 million ETH.
At the current price of roughly $4,440, this addition is worth close to $4 billion — one of the largest single-day whale inflows in recent weeks.
Want more token insights like this? Sign up for Editor Harsh Notariya’s Daily Crypto Newsletter here.
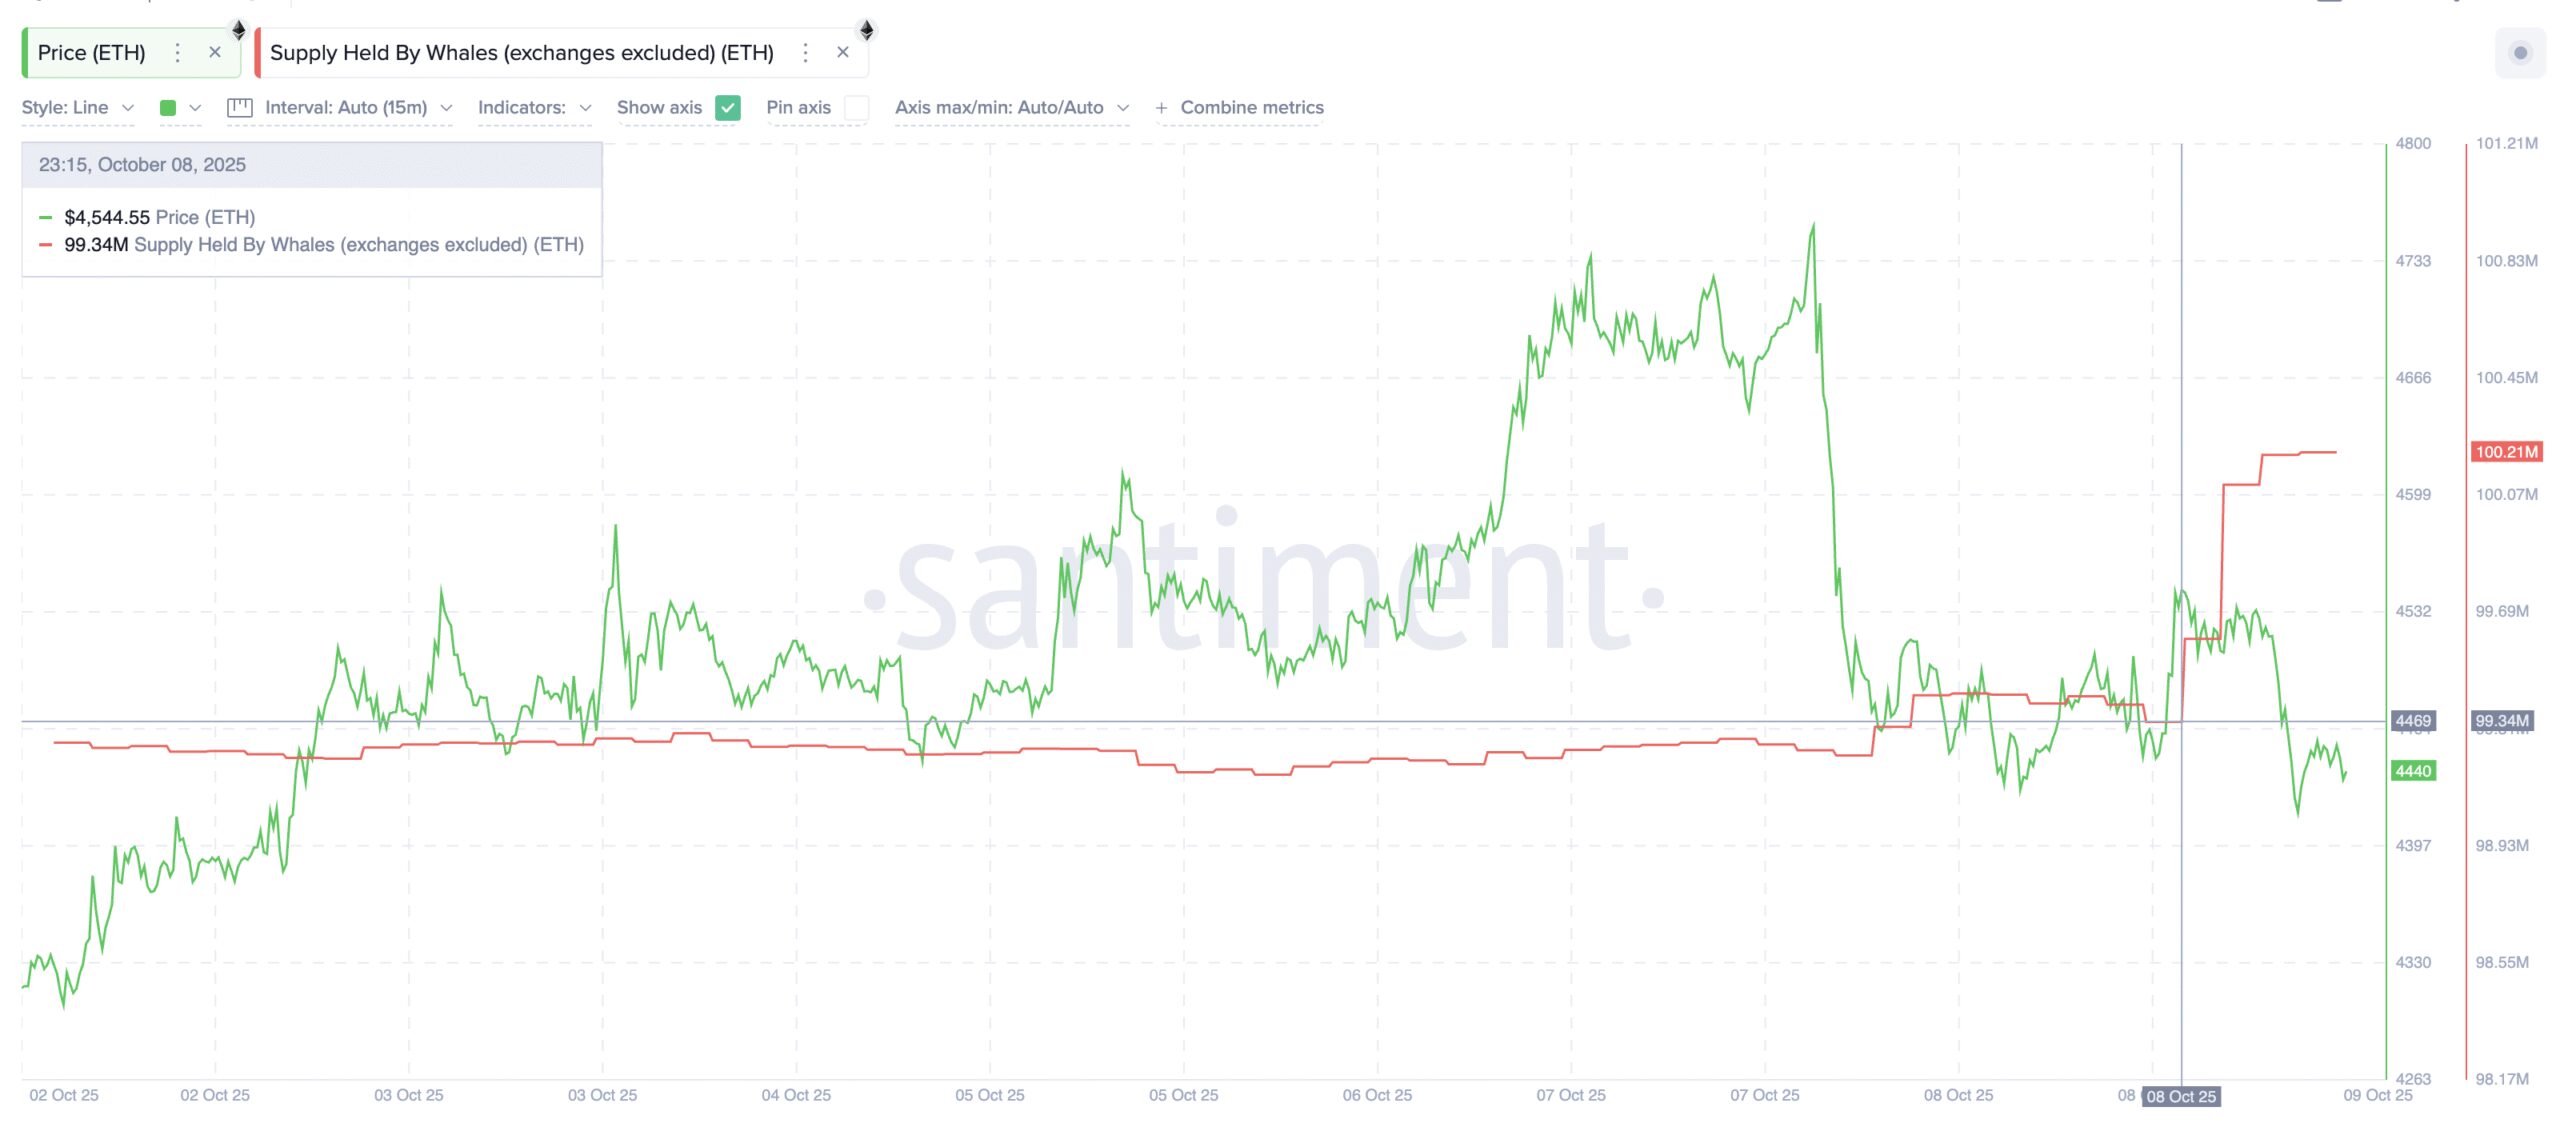
Such moves typically suggest that deep-pocketed investors are positioning for an upward breakout rather than exiting after a rally.
At the same time, activity among smaller but active cohorts is also rising. According to Glassnode’s HODL Waves, a metric that tracks how long coins have been held by different age groups, both short-term bands have expanded notably.
The 24-hour cohort grew from 0.34% to 0.87% since October 4, while the 1–3 month group rose from 11.57% to 12.36%, week-on-week.
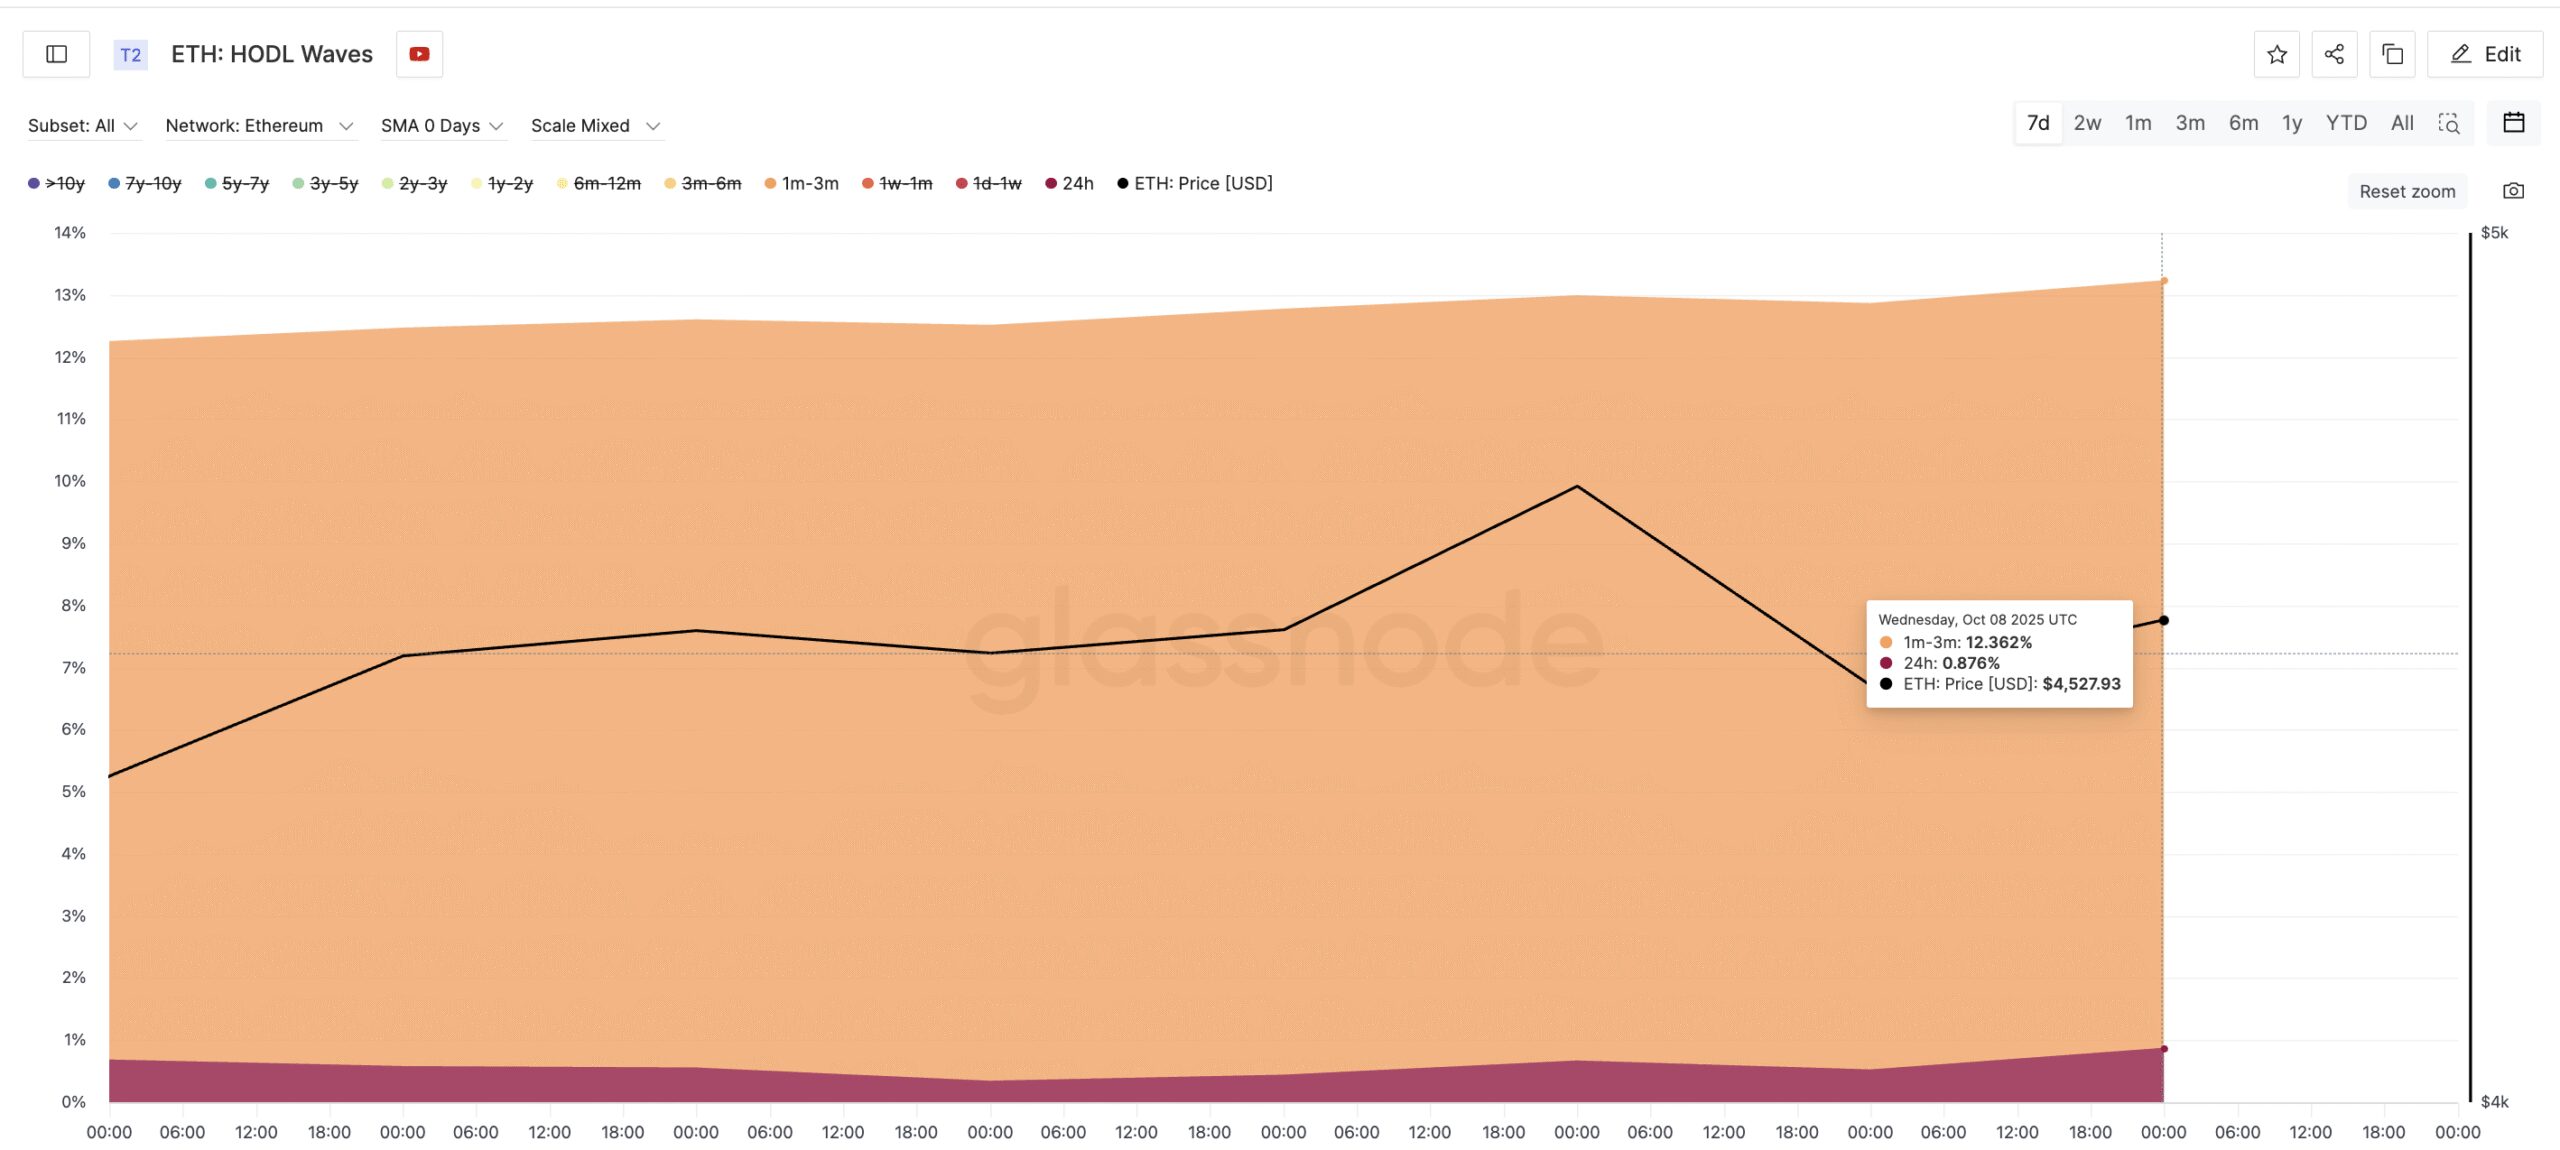
Rising short-term holdings, especially during a slow price week, generally indicate that more traders are re-entering the market, adding liquidity and momentum during early accumulation stages.
The combination of whale inflows and short-term buildup hints that Ethereum’s current calm could be masking preparation for a stronger directional move.
Ethereum Price Chart Structure Supports the Accumulation Narrative
Ethereum’s chart setup echoes this on-chain optimism. The asset trades between two key Fibonacci levels — $4,400 and $4,620 — while forming an ascending triangle, a structure where the price makes higher lows against a flat resistance line.
This pattern often signals a buildup before a breakout.
Moreover, a hidden bullish divergence appeared on the daily chart between August 25 and October 9. This happens when the price forms higher lows while the Relative Strength Index (RSI), a tool that measures market momentum and overbought or oversold conditions, forms lower lows.
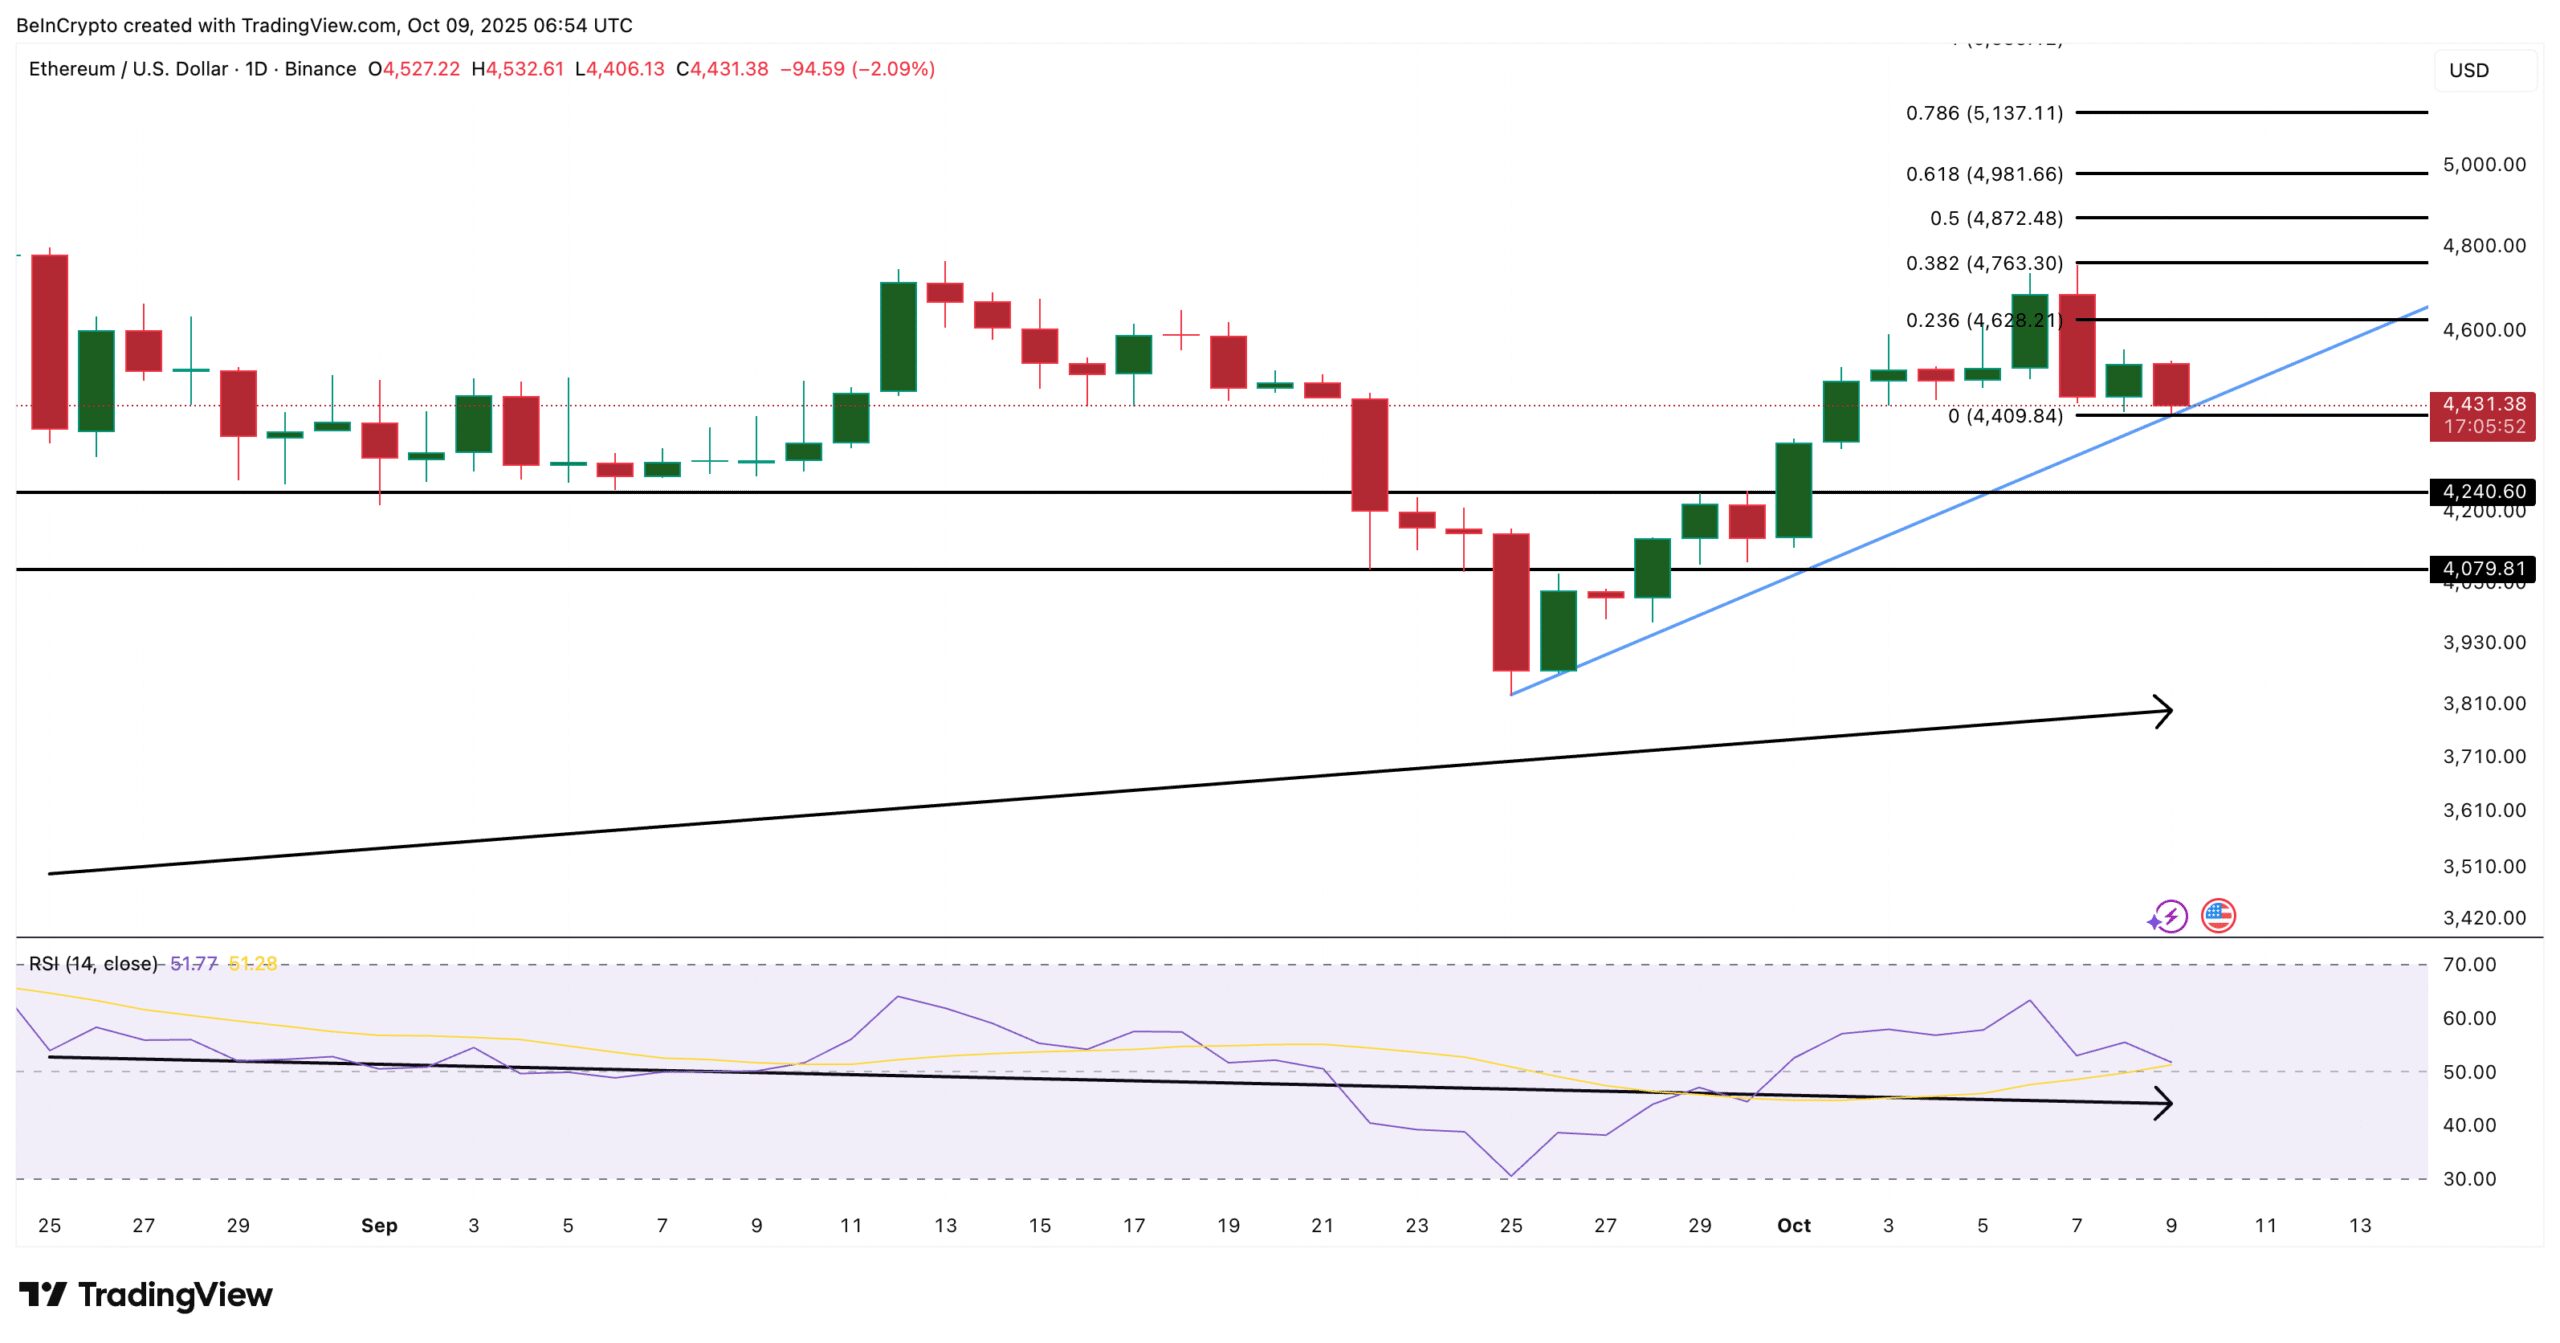
Hidden bullish divergence typically appears during corrections within an uptrend, signaling that the broader move higher is likely to continue.
The signal usually points to weakening selling pressure and potential continuation of the ongoing trend, which is on the upside for the Ethereum price.
If Ethereum closes decisively above $4,620, a rally toward $4,870 and $5,130 could follow as the breakout confirms. Conversely, if it slips below $4,400 (daily candle close and not just a breakout), a pullback toward $4,240 or even $4,070 becomes likely, invalidating the short-term bullish case.
For now, both whales and short-term traders appear to be betting on one key event: whether Ethereum can finally break and hold above $4,620 to start its next major leg higher.
The post Ethereum Whales Pin Nearly $4 Billion on Breakout Hopes, but $4,620 Is the Key appeared first on BeInCrypto.