
Ethereum has gained more than 68% over the past three months, putting most near-term holders firmly in profit. Yet over the past week, the asset has stalled — losing 4.7% and trading flat in the last 24 hours.
This consolidation has pushed the Ethereum price inside a pattern of indecision where bulls and bears battle for control. While such setups can resolve in either direction, two on-chain metrics suggest the next move may favor the upside.
Metric 1: Profit Supply Drop Points To Seller Exhaustion
The percentage of ETH supply in profit dropped from 98.4% on August 26 to a local bottom of 92.7% on September 1 — its second-lowest reading in a month. Normally, such declines reflect heavy profit-taking. But once profit supply hits local bottoms, ETH has historically rallied. For example, when the ratio fell to 91.8% earlier in August, ETH surged from $3,612 to $4,748 (over 31%) in just eight days.
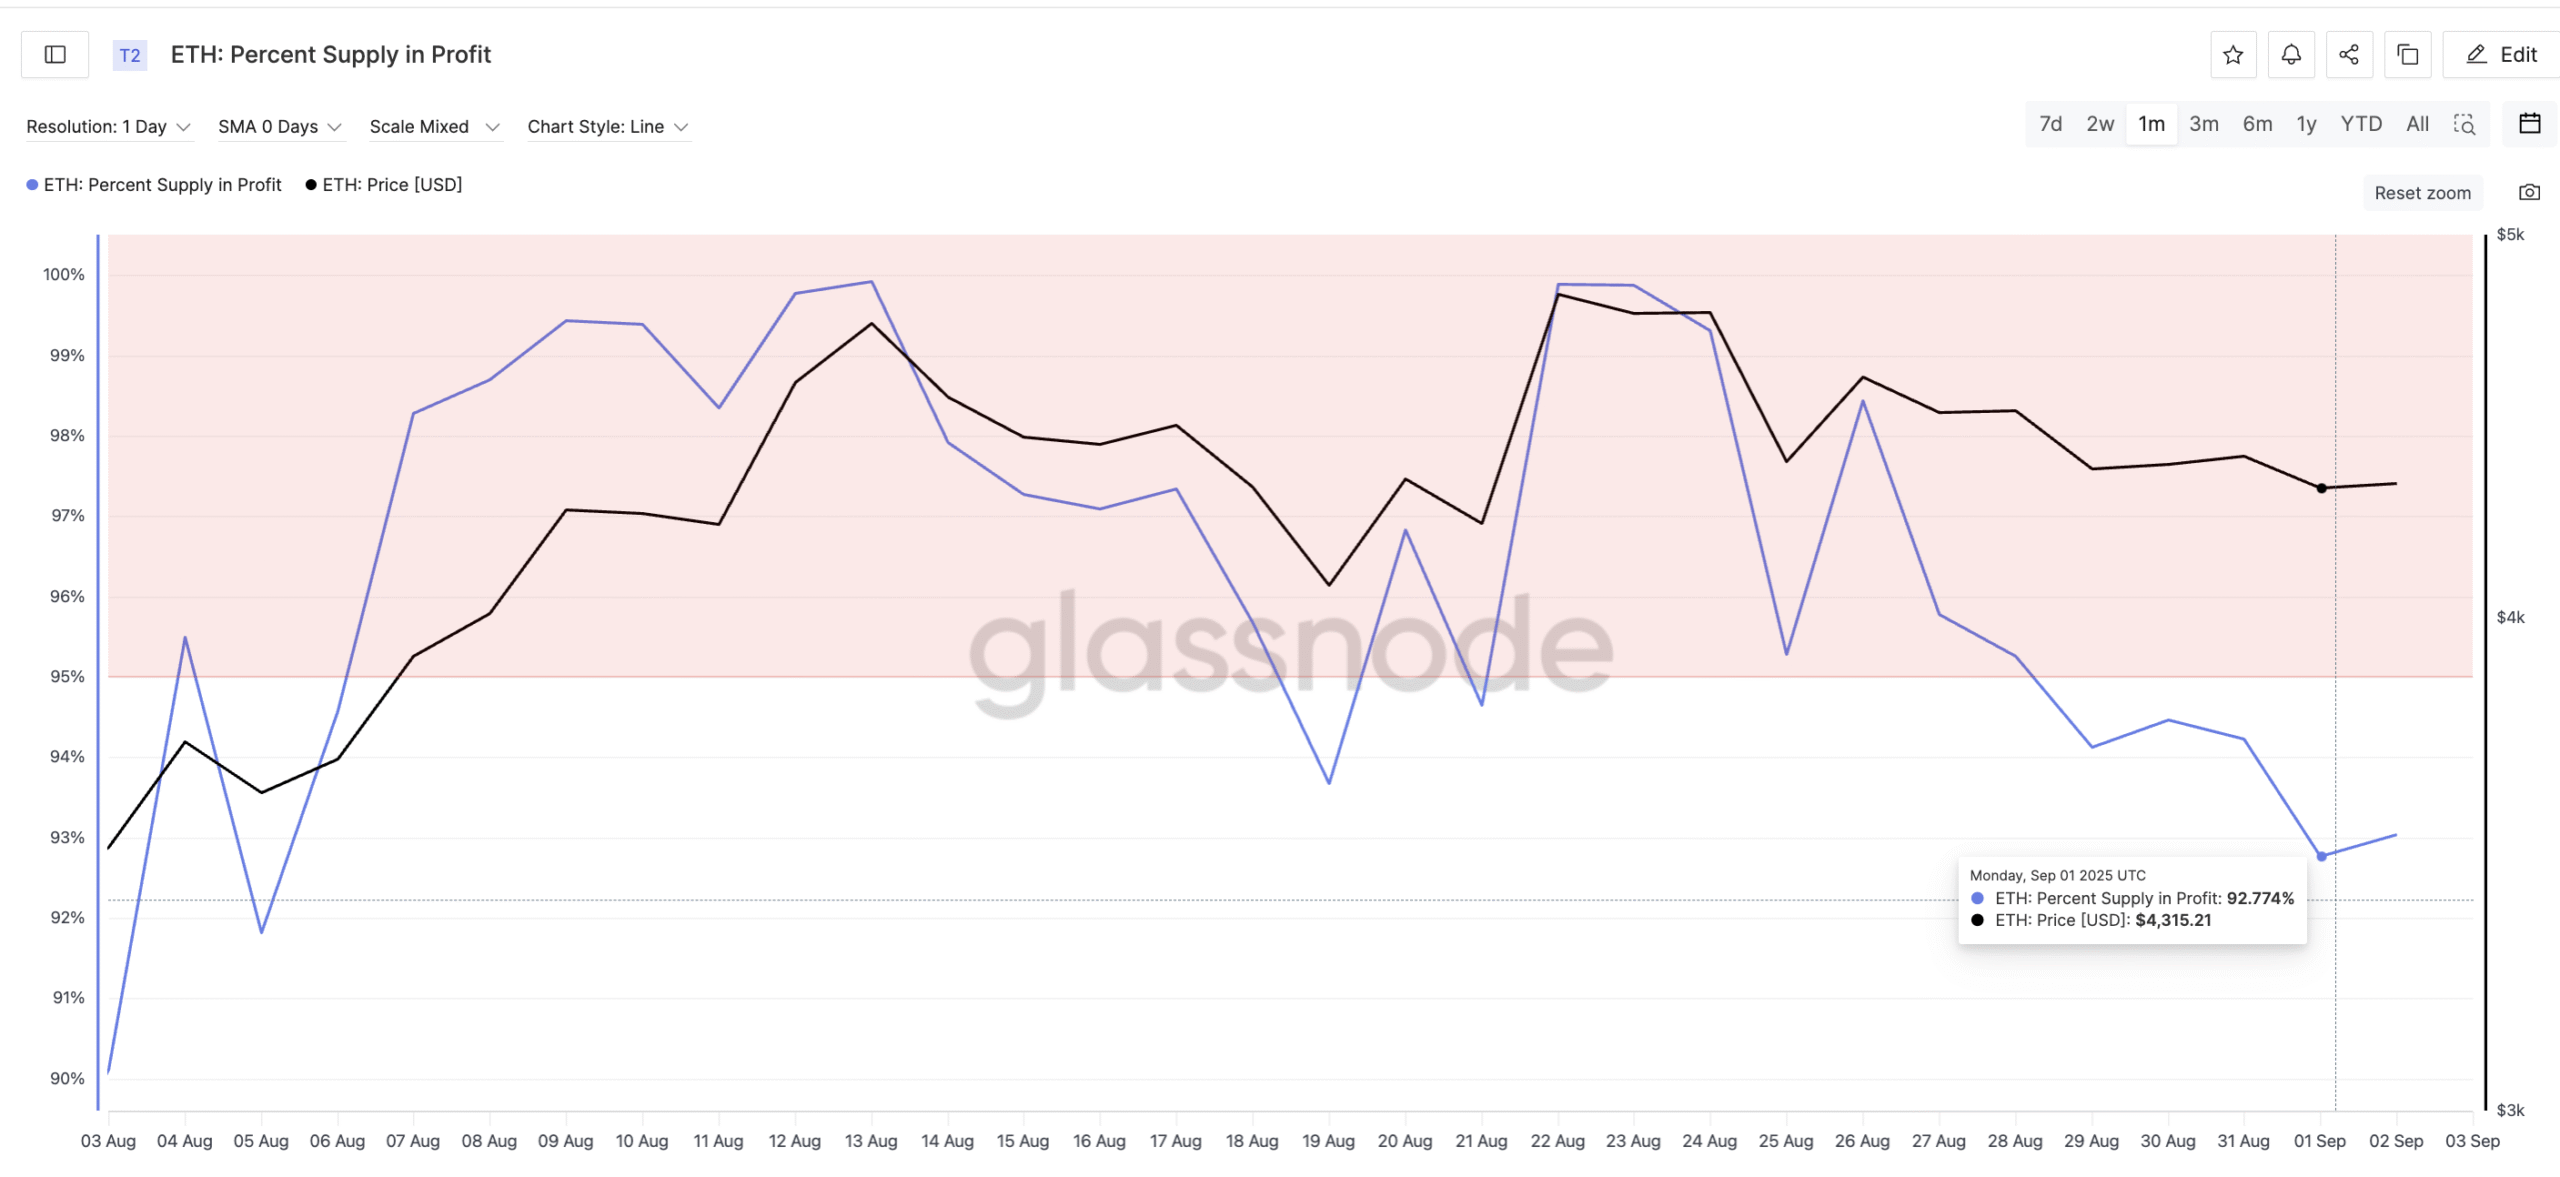
This drop means a wave of sellers may already be out of the market, leaving ETH with fewer profit-sensitive holders who might panic-sell. In other words, selling intensity has likely weakened at a time when the Ethereum price is already consolidating at a breakout zone. And that’s a bullish sign.
Want more token insights like this? Sign up for Editor Harsh Notariya’s Daily Crypto Newsletter here.
Metric 2: Short-Term Holders Accumulate Despite Gains
The more surprising detail is that the group most prone to profit-taking — one- to three-month holders — has been adding supply. Their share rose from 10.9% to 13% in just two weeks, even though ETH delivered over 20% monthly gains and more than 68% in three months.
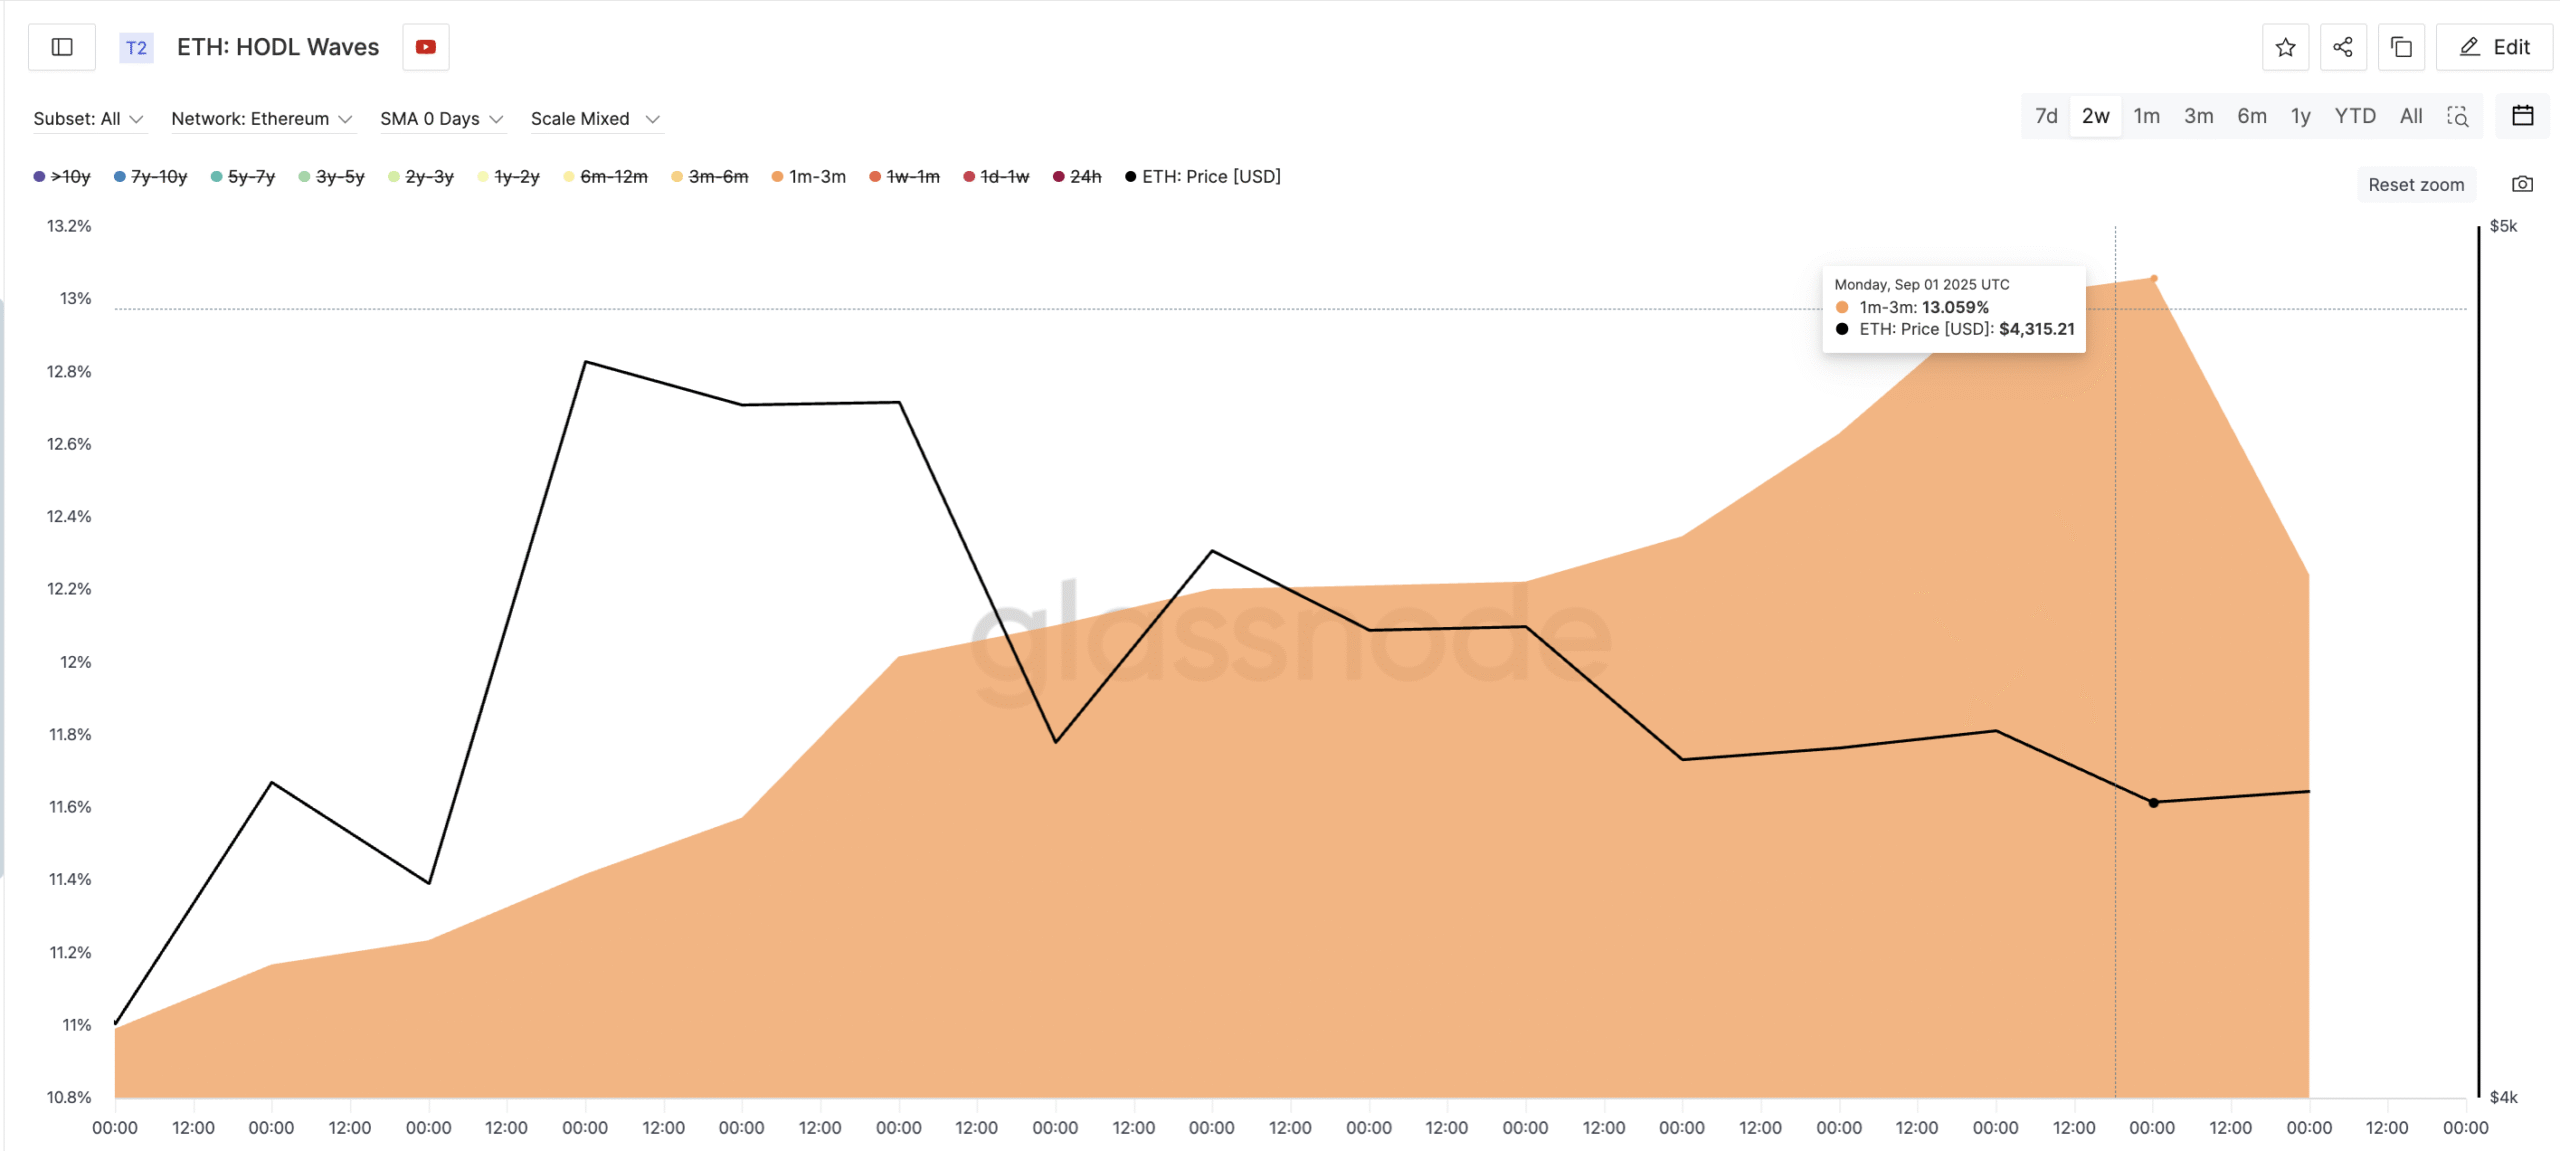
This shows that traders who usually flip positions quickly are instead accumulating, signaling confidence in further upside. Combined with the low profit-supply reading, this HODL Waves finding paints a picture of reduced sell pressure and hidden demand building up behind ETH’s consolidation.
HODL Waves measure the distribution of a cryptocurrency’s supply by the age of coins held in wallets.
Ethereum Price Action And OBV Confirm Accumulation
On the chart, the ETH price trades inside a symmetrical triangle with support near $4,211 and resistance at $4,386. While price has made lower lows during this consolidation, On-Balance Volume (OBV) has made higher lows. OBV tracks whether trading volume is dominated by buyers or sellers, and this divergence suggests accumulation continues beneath the surface.
The OBV metric confirms what we saw earlier, while dicussing HODL waves.
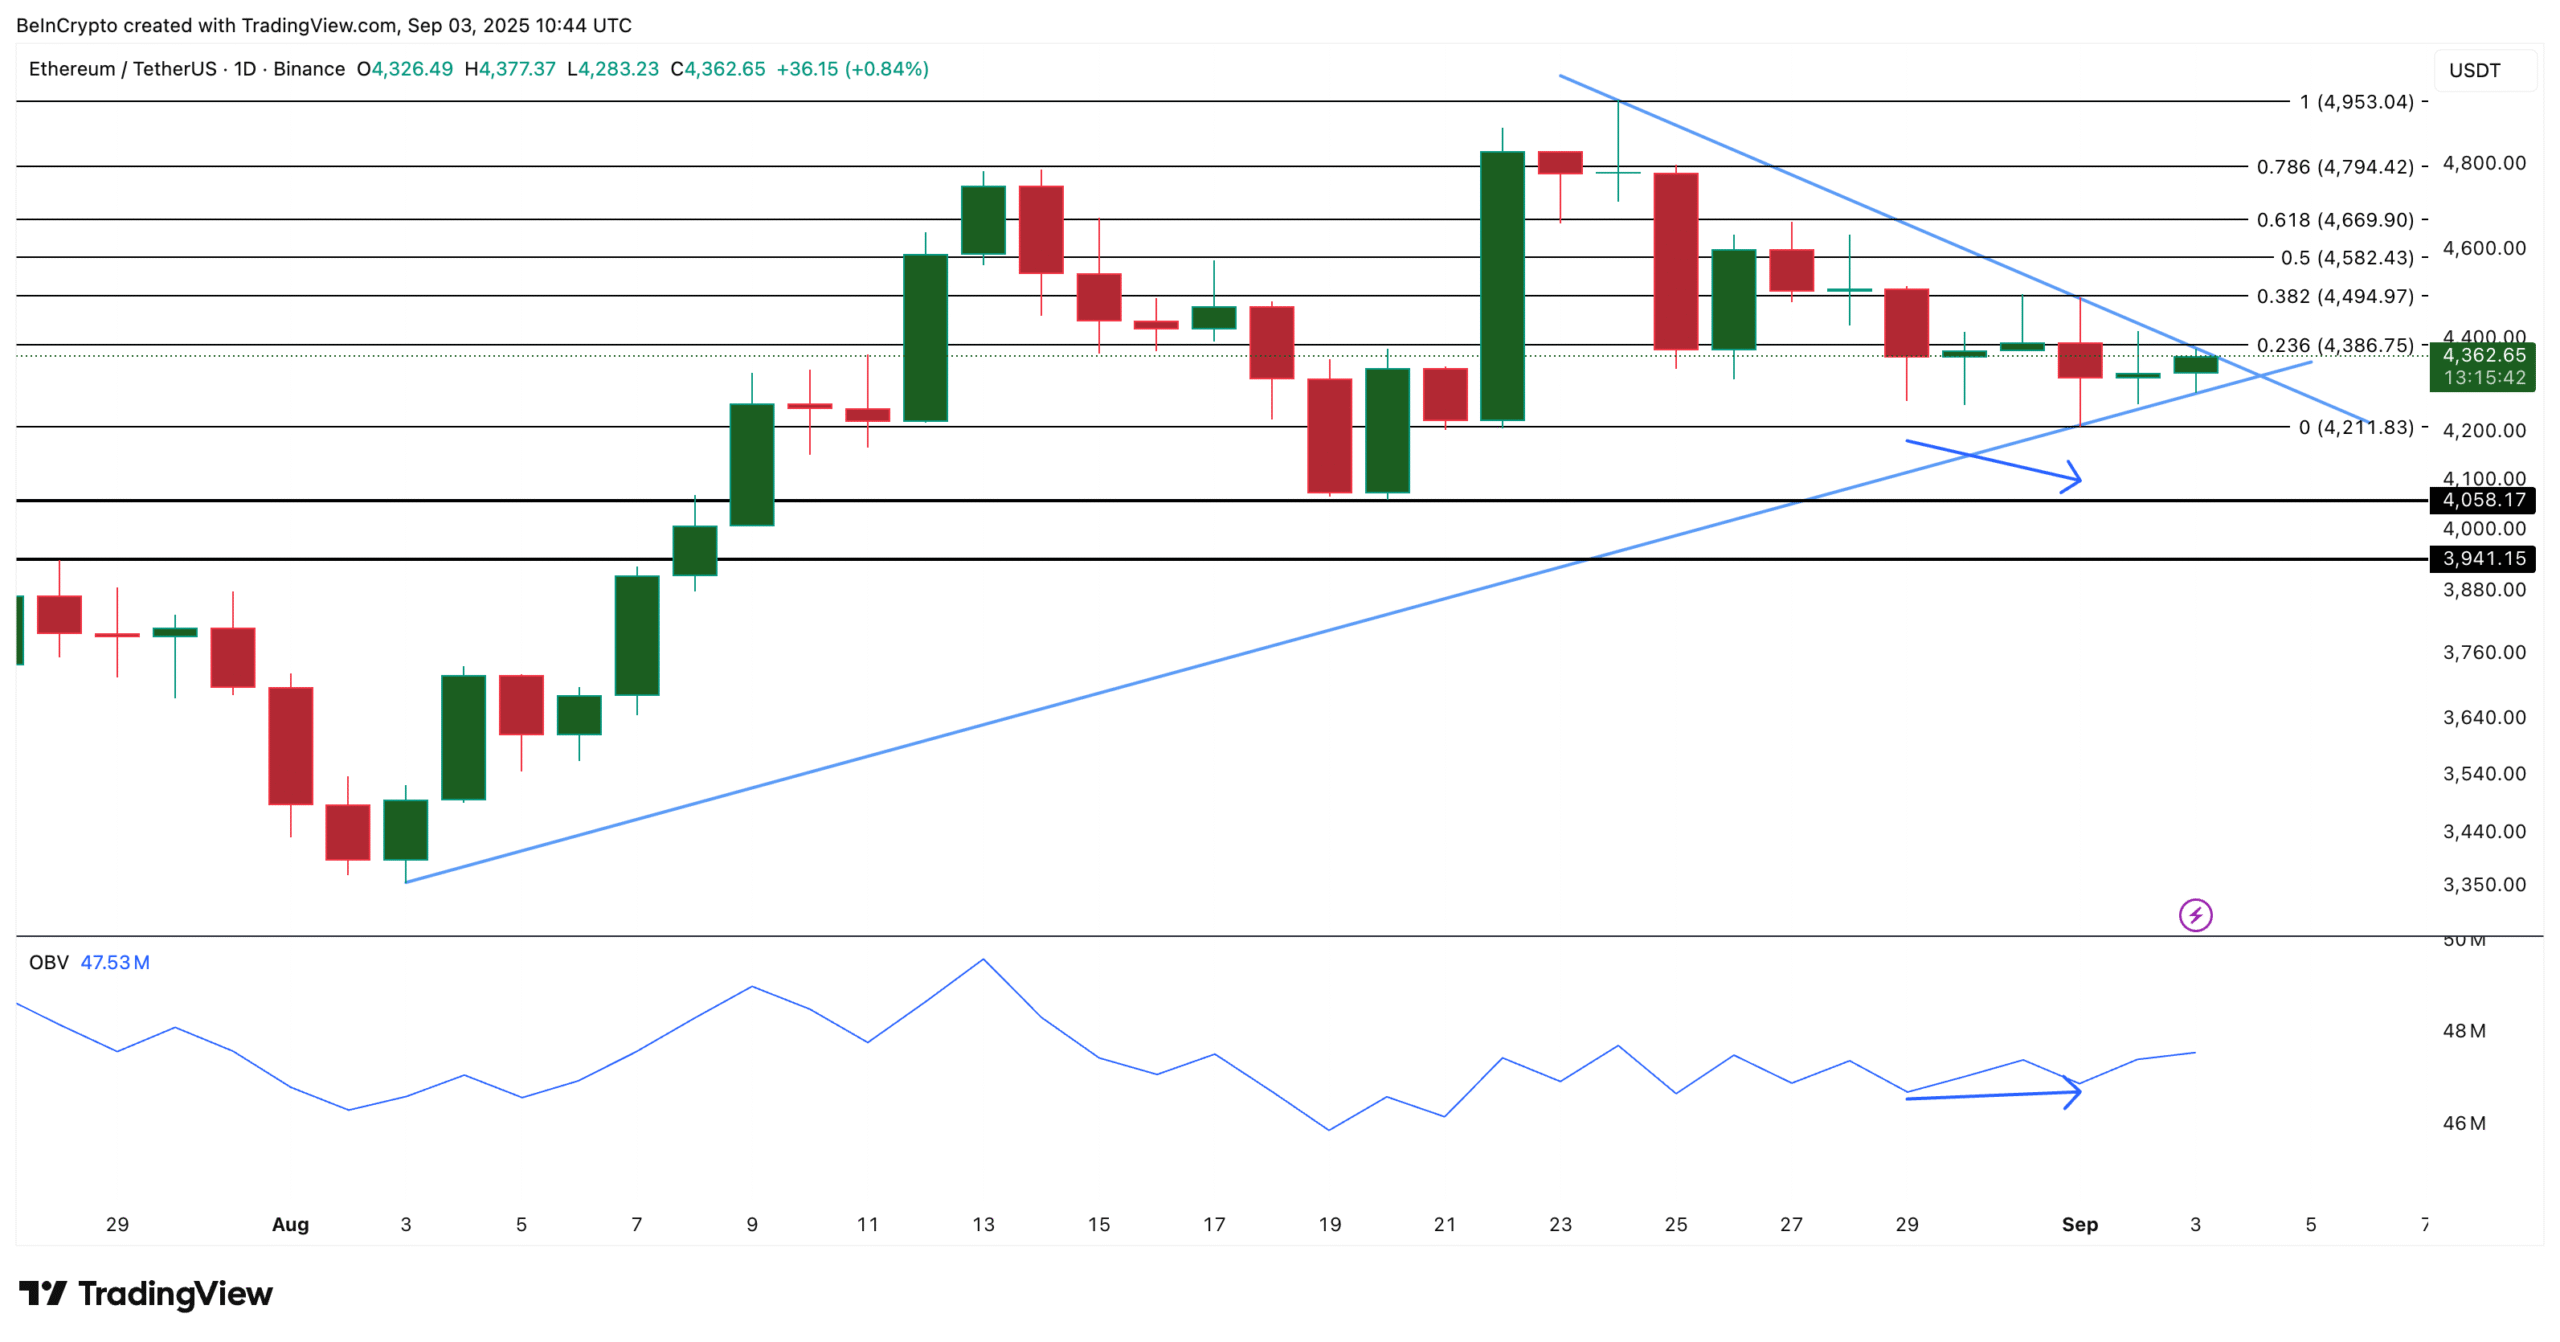
The alignment of Ethereum price action and volume signals strengthens the case for a bullish breakout.
A close above $4,494 would unlock $4,669 as the next hurdle and $4,794 as the extended target. A drop below $4,211 would weaken the setup, while $4,058 remains the deeper support if bears take over.
The post Ethereum Price Tests Breakout Zone With 2 Metrics Pointing Toward the Upside appeared first on BeInCrypto.
